

Image Details
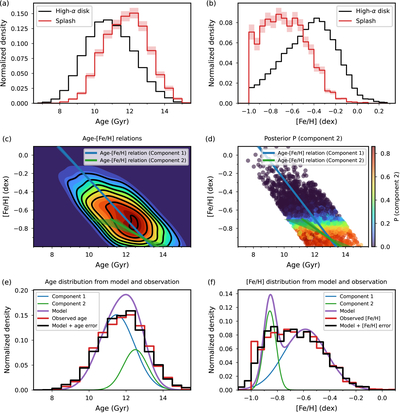
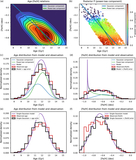
Caption: Figure 2.
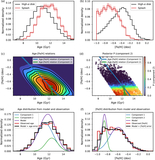
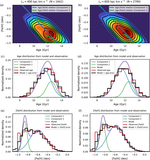
Two-Gaussian decomposition of the age–metallicity ([Fe/H]) distribution of the Splash population. (a)–(b) Selection-corrected age and metallicity distributions, respectively, of the high-α disk (black) and Splash population (red). Red shading shows the selection-weighted counting uncertainty of the Splash population, calculated in each bin B as ﹩{\sigma }_{{W}_{B}}={({\sum }_{i\in B}{\omega }_{i}^{2})}^{1/2}﹩ and normalized by the total selection weight. (c) Inverse-selection-weighted kernel density estimation (KDE) of Splash stars in the age–[Fe/H] plane; colors and black contours indicate the smoothed density and its isodensity levels. Blue and green lines show the best-fitting relations of the two Gaussian components, with shaded point-wise 16th–84th percentile intervals derived from bootstrap refits. The green relation and its uncertainty band are displayed only in the metal-poor regime, [Fe/H] ≤ −0.7, where Component 2 is concentrated. (d) Posterior probability that each star belongs to Component 2, with the same fitted relations and uncertainty bands as in panel (c). (e)–(f) Comparison between the selection-corrected observed age and [Fe/H] distributions and the predictions of the best-fitting intrinsic model, respectively. Blue and green curves show the individual model components, the purple curve is their sum, and red and black histograms show the selection-corrected observations and mock realizations drawn from the best-fitting model, respectively. Mock ages include a 6.7% fractional uncertainty, while mock metallicity uncertainties are drawn locally from observed stars of similar [Fe/H].
Other Images in This Article
Copyright and Terms & Conditions
© 2026. The Author(s). Published by the American Astronomical Society.

