

Image Details
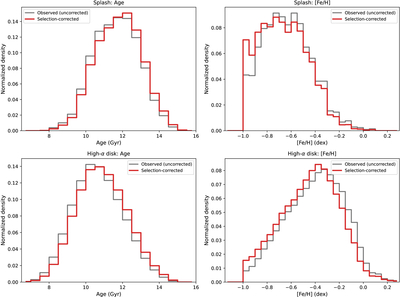
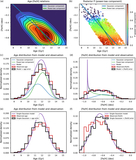
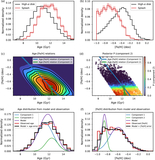
Caption: Figure A1.
Age and metallicity distributions before and after correction for selection effects. The normalized probability-density distributions of age (left panels) and [Fe/H] (right panels) are shown for the Splash (top panels) and high-α disk (bottom panels) samples. The gray and red histograms represent the observed distributions before correction and the selection-corrected distributions, respectively. The corrected distributions are calculated using normalized inverse-selection weights, ωi ∝ 1/si, where si = s(τi, [Fe/H]i, [α/Fe]i). Each histogram is independently normalized to unit integral.
Other Images in This Article
Copyright and Terms & Conditions
© 2026. The Author(s). Published by the American Astronomical Society.

Copyright ©
2026 Astronomy Image Explorer. All Rights Reserved.
