

Image Details
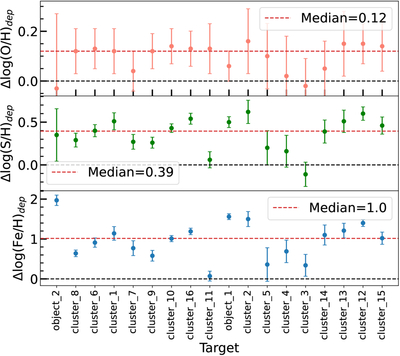
Caption: Figure E1.
Plotting change in abundance due to depletion(Δlog(X/H)dep = (X/H)depleted - (X/H)ICF) for each observed neutral gas element, X, for each YSC in M83 observed with VLT/COS. The three subplots from bottom to top show values for X = Fe, S, and O. The median Δlog(X/H)dep is plotted as a horizontal orange line in each subplot.
Other Images in This Article
Show More
Copyright and Terms & Conditions
© 2026. The Author(s). Published by the American Astronomical Society.

Copyright ©
2026 Astronomy Image Explorer. All Rights Reserved.
