

Image Details
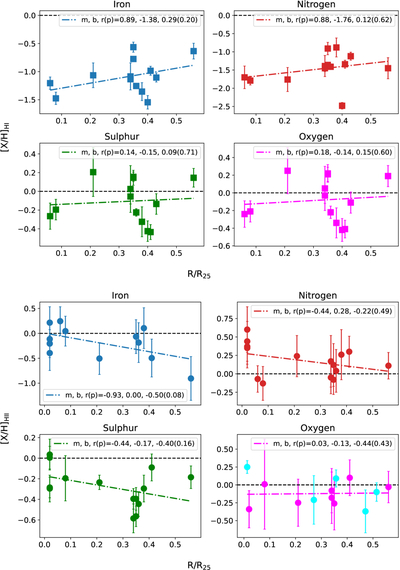
Caption: Figure 17.
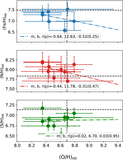
Elemental abundance (relative to solar) in neutral (top) and ionized (bottom) gas as a function of galactocentric radius, R/R25. The horizontal black dashed line represents the solar value. The cyan points within the H II region oxygen plot, taken from F. Bresolin et al. (2005), are shown for comparison and included in the statistics. Only the ionized gas figure (bottom) includes points from the galactic center (r/r25 < 0.05; see discussion in Section 4.1).
Other Images in This Article
Show More
Copyright and Terms & Conditions
© 2026. The Author(s). Published by the American Astronomical Society.

Copyright ©
2026 Astronomy Image Explorer. All Rights Reserved.
