

Image Details
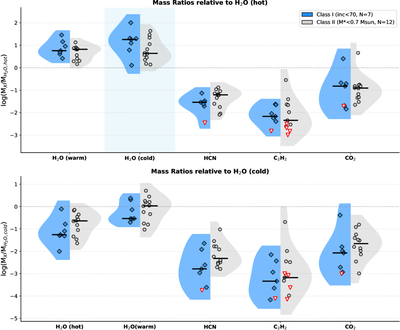
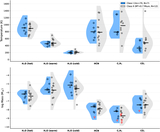
Caption: Figure 8.
Violin plots of molecular mass ratios for Class I/FS (i < 70∘; blue) and Class II (gray) disks. Top panel: mass ratios normalized to hot water. Bottom panel: mass ratios normalized to cold water. Individual sources are shown as points, with upper limits indicated by downward-pointing arrows. When normalized to hot water, the ratios of HCN, C2H2, and CO2 are similar between the two classes, but the cold-to-hot-water ratio is elevated in Class I/FS (median ﹩\mathrm{log}({M}_{{\rm{cold}}}/{M}_{{\rm{hot}}})=1.30﹩ vs. 0.63). When normalized to cold water, all ratios are systematically lower in Class I/FS, indicating that the chemical difference is driven by a cold water excess rather than a carbon-species deficit.
Other Images in This Article
Show More
Copyright and Terms & Conditions
© 2026. The Author(s). Published by the American Astronomical Society.

