

Image Details
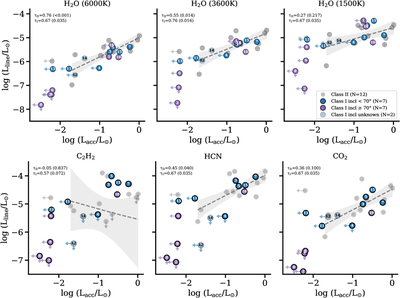
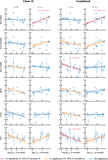
Caption: Figure 4.
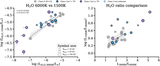
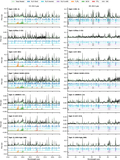
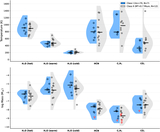
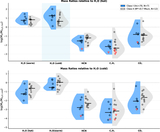
Line luminosities as a function of accretion luminosity. Top: diagnostic water lines. Bottom: HCN, C2H2, and CO2. The Class I/FS and II samples generally follow the same trends, but Class I/FS shows larger scatter in the water lines. The gray dashed line and shaded band show the censored linmix fit (B. C. Kelly 2007) to the Class II reference sample (16th–84th percentile of the posterior), which includes the upper limits; a separate Class I/FS linmix fit is not shown because too few Class I/FS sources have Lacc detections. The generalized (censored) Kendall τ and its p-value are annotated in each panel for the Class II (τII) and Class I/FS (i < 70∘; τI) samples, computed separately so the two trends can be compared.
Other Images in This Article
Show More
Copyright and Terms & Conditions
© 2026. The Author(s). Published by the American Astronomical Society.

