

Image Details
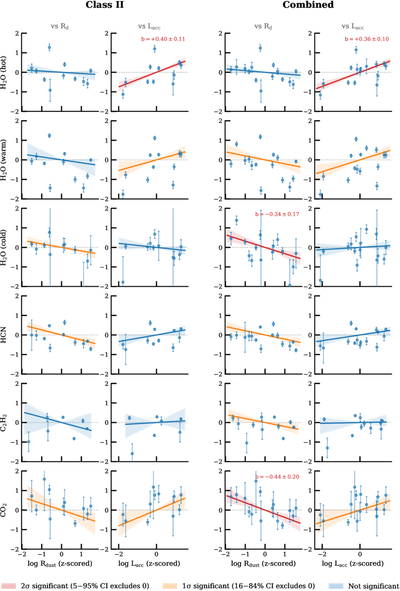
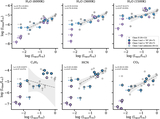
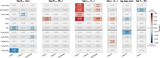
Caption: Figure 10.
Partial residuals from the multivariate regression of log slab mass on z-scored log Rdust and log Lacc, for the Class II (left) and Combined (right) samples. Rows correspond to the six molecular tracers and columns to the two predictors. The band color indicates the significance of the slope: red = strongly significant (2σ; 5%–95% CI excludes zero), orange = significant (1σ; 16%–84% CI excludes zero), blue = not significant. Uncertainties are estimated from 1500 bootstrap iterations with iterative weighted least squares incorporating measurement errors on both predictors and the response variable. The Class I/FS sample is not shown separately because only four sources remain after excluding Lacc upper limits.
Other Images in This Article
Show More
Copyright and Terms & Conditions
© 2026. The Author(s). Published by the American Astronomical Society.

