

Image Details
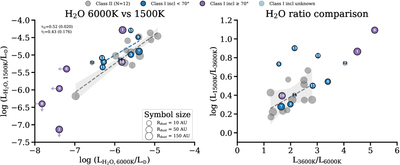
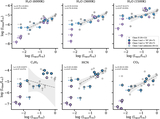
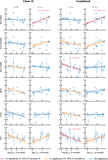
Caption: Figure 5.
Water line luminosity diagnostic plot. Left: the line luminosities of hot and cold water transitions cover a similar luminosity range and trend to the Class II sample. The gray dashed line and shaded band show the censored linmix fit to the Class II reference sample (16th–84th percentile), and the blue dashed line shows the corresponding Class I/FS (i < 70∘) linmix fit (both hot water axes are fully detected here, so both fits are constrained); the two slopes (0.83 ± 0.18 and 0.67 ± 0.56) agree within the uncertainties. The censored Kendall τ for the Class II (τII) and Class I/FS (τI) samples are annotated. Right: line luminosity ratios among water lines: the majority of the Class I/FS sources cover the upper half of the plot, suggesting that these have an excess of cold or warm water fluxes compared to many Class II sources.
Other Images in This Article
Show More
Copyright and Terms & Conditions
© 2026. The Author(s). Published by the American Astronomical Society.

