

Image Details
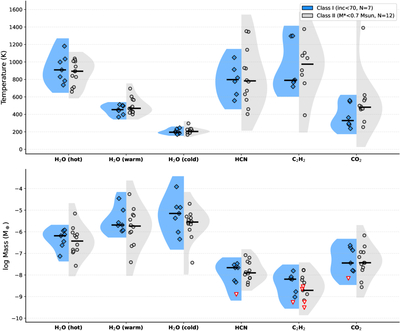
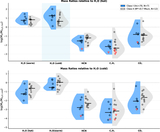
Caption: Figure 7.
Comparison of slab model parameters between Class I/FS (i < 70∘; blue) and Class II (gray) disks. Top panel: excitation temperatures for the three water components (hot, warm, cold), HCN, C2H2, and CO2. Bottom panel: log emitting masses for the same species. Individual sources are shown as points; violin plots show the kernel density estimate of each distribution, and horizontal bars mark the median. Upper limits are indicated by red downward-pointing arrows. The three water components have comparable temperatures in both classes, while the median temperature of CO2 is colder in Class I/FS (329 vs. 482 K) with 1.5σ separation.
Other Images in This Article
Show More
Copyright and Terms & Conditions
© 2026. The Author(s). Published by the American Astronomical Society.

