

Image Details
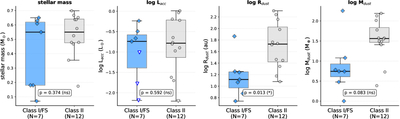
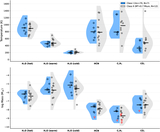
Caption: Figure 1.
Comparison of stellar and disk properties between the Class I/FS (i < 70∘) and Class II samples. The horizontal bars show the median values of each group. The p-values shown are from a Mann–Whitney U test (also known as the Wilcoxon rank-sum test) comparing the distributions of each property between the two samples. This nonparametric test assesses whether the two classes are drawn from the same underlying distribution, with “ns” indicating nonsignificant (p > 0.05) and “*” indicating significant (p < 0.05) differences—only the dust disk radius (Rdust) shows a statistically significant difference between the two samples.
Other Images in This Article
Show More
Copyright and Terms & Conditions
© 2026. The Author(s). Published by the American Astronomical Society.

