

Image Details
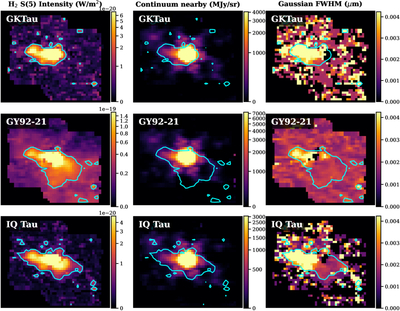
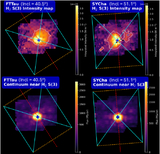
Caption: Figure 15.
The left column shows the pixel-by-pixel, line-integrated H2 S(5) intensity map, with the 5σ contour overlaid in cyan, where σ is the background standard deviation calculated iteratively. The middle column presents a continuum slice near the S(5) line wavelength for the respective targets. The right column displays the full width at half-maximum (FWHM) of the 1D Gaussian fitted at each pixel during the construction of the intensity maps. The FWHM is only shown for pixels with Gaussian fits stronger than 3σ. The cyan contours remain identical across each row.
Other Images in This Article
Show More
Copyright and Terms & Conditions
© 2026. The Author(s). Published by the American Astronomical Society.

Copyright ©
2026 Astronomy Image Explorer. All Rights Reserved.
