

Image Details
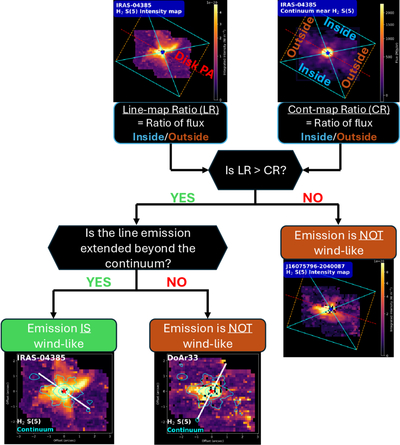
Caption: Figure 3.
This flowchart outlines our strategy to identify windlike H2 emission as described in Section 3.2. Only line maps that appear spatially resolved relative to the PSF in the flux curves (see Figure 2) are investigated for wind emission using this flowchart. Every line map shown in the flowchart is subtracted for continuum and integrated under a 1D Gaussian in every spaxel.
Other Images in This Article
Show More
Copyright and Terms & Conditions
© 2026. The Author(s). Published by the American Astronomical Society.

Copyright ©
2026 Astronomy Image Explorer. All Rights Reserved.
