

Image Details
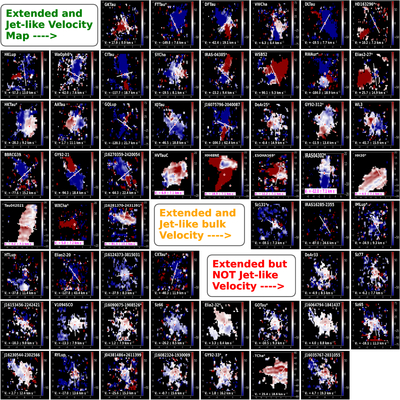
Caption: Figure 6.
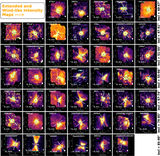
[Ne II] velocity maps for sources with spatially extended [Ne II] emission. In each of the three categories, the sources are ordered by increasing disk inclination (read from left to right and top to bottom). The velocities (in each pixel and vc) are corrected for stellar radial velocity and disk inclination. Only pixels with flux greater than 2σ are shown, where σ is the standard deviation of the background calculated iteratively. The red star in each map marks the centroid of the corresponding continuum, and the white horizontal line passing through it highlights the known disk PA (Table 1). Sources with asterisks are further discussed in Appendix D. The highly inclined disks (incl. > 80°) are indicated by highlighting their vc in magenta, and their maps (as well as vc) are not deprojected for inclination. The [Ne II] jetlike velocity maps show broader emission than expected for jets; however, this is a PSF effect, and deconvolution reveals [Ne II] jets that are narrower than H2 winds (e.g., SY Cha; K. R. Schwarz et al. 2025). The [Ne II] spectra toward each source in this figure and the corresponding Gaussian fits to estimate vc are shown in Appendix B.
Other Images in This Article
Show More
Copyright and Terms & Conditions
© 2026. The Author(s). Published by the American Astronomical Society.

