

Image Details
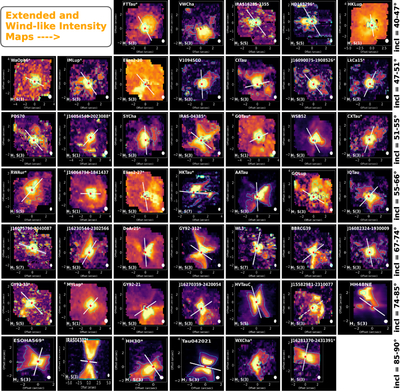
Caption: Figure 5.
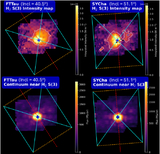
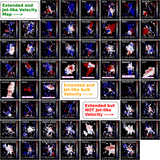
Intensity maps for sources with H2 winds, with the red stars highlighting the corresponding continuum centroid locations (for incl. > 80° disks, the centroid is shifted to roughly the center of the dark lane visible in continuum or line map), and white lines showing the disk PAs where available (Table 1). Primarily, S(3) maps are shown; however, when the wind is not detected in S(3), then S(1), S(5), or S(7) maps are presented instead. Multiple-star systems without clear H2 winds are not included; highly inclined disks are included. The maps are ordered by increasing disk inclination. Sources with asterisks (*) are further discussed in Appendix D. The direction of north in each map can be inferred from Figure 13 in Appendix A.
Other Images in This Article
Show More
Copyright and Terms & Conditions
© 2026. The Author(s). Published by the American Astronomical Society.

