

Image Details
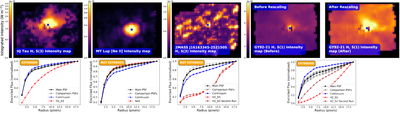
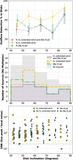
Caption: Figure 2.
Examples of the methodology employed to identify spatially extended emission with respect to the MIRI PSF. On top are the spaxel-by-spaxel, continuum-subtracted, intensity-integrated maps of the mentioned lines, where the blue stars represent the centroids of the corresponding continuum. For GY92-21, two maps are shown, one before rescaling the emission and one after (see Section 3.1 for details). On the bottom are the encircled-flux curves as described in the main text, with the conclusion about the emission’s extent written in the top left.
Other Images in This Article
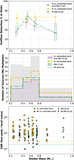
Show More
Copyright and Terms & Conditions
© 2026. The Author(s). Published by the American Astronomical Society.

Copyright ©
2026 Astronomy Image Explorer. All Rights Reserved.
