

Image Details
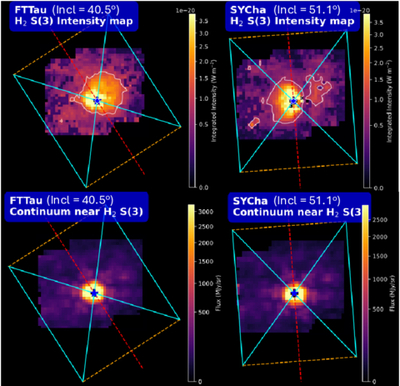
Caption: Figure 4.
H2 S(3) line-intensity and continuum maps for FT Tau (incl. = 40﹩\mathop{.}\limits^{{\unicode{x000b0}}}﹩5) and SY Cha (incl. = 51﹩\mathop{.}\limits^{{\unicode{x000b0}}}﹩1). The blue stars show the continuum centroids, and the red dashed lines show the known disk PAs from literature ALMA results (Table 1).
Other Images in This Article
Show More
Copyright and Terms & Conditions
© 2026. The Author(s). Published by the American Astronomical Society.

Copyright ©
2026 Astronomy Image Explorer. All Rights Reserved.
