

Image Details
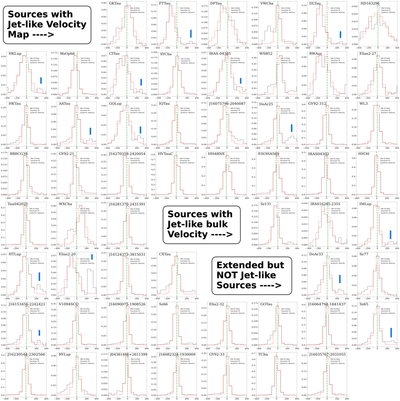
Caption: Figure 14.
[Ne II] spectrum for sources with extended [Ne II] emission plotted in units of velocity (km s–1). The sources are arranged the same way as in Figure 6. For each source, the continuum-subtracted line emission is shown in gray, and the best-fit 1D Gaussian is shown in red with the systemic velocity (shifted to zero) highlighted in green. Emission beyond 200 km s−1 from the systemic velocity arises from H2O and is highlighted with a blue vertical line in cases where it is particularly strong.
Other Images in This Article
Show More
Copyright and Terms & Conditions
© 2026. The Author(s). Published by the American Astronomical Society.

Copyright ©
2026 Astronomy Image Explorer. All Rights Reserved.
