

Image Details
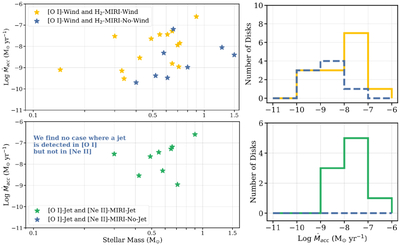
Caption: Figure 12.
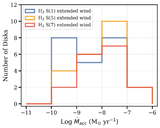
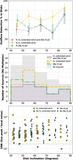
Left panels: stellar mass versus mass accretion rate for sources with wind detections in both H2 and [O I], or just [O I] and jet detections in both [Ne II] and [O I], or just [O I]. The color of each point, along with the adjacent histograms, corresponds to the categories listed in the legend. Right panels: histograms of the mass accretion rates for the same source categories shown in the left panels. Known multiple-star systems exhibiting these properties are excluded from the plot. We also note that although many highly inclined disks show jet and wind detections in the MIRI data, they are not included here due to the lack of accretion rate estimates and/or [O I] data.
Other Images in This Article
Show More
Copyright and Terms & Conditions
© 2026. The Author(s). Published by the American Astronomical Society.

