

Image Details
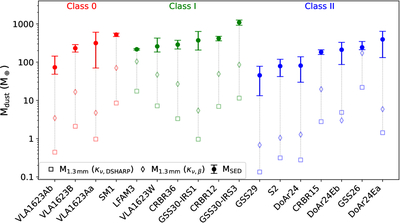
Caption: Figure 7.
Dust masses derived for each object employing three methods, ordered by class and increasing SED dust mass. Filled circles show masses derived using the multiwavelength radio SED analysis described in Section 3.4.2, with errors as shown in Table 3. The remaining two methods use a singular ALMA 1.3 mm (Band 6) flux density and Equation (5) but with differing opacities. Open squares signify masses calculated using opacities derived from our dust model (κν,DSHARP), while open diamonds adopt the S. V. W. Beckwith et al. (1990) opacity power-law prescription (κν,β).
Other Images in This Article
Show More
Copyright and Terms & Conditions
© 2026. The Author(s). Published by the American Astronomical Society.

Copyright ©
2026 Astronomy Image Explorer. All Rights Reserved.
