

Image Details
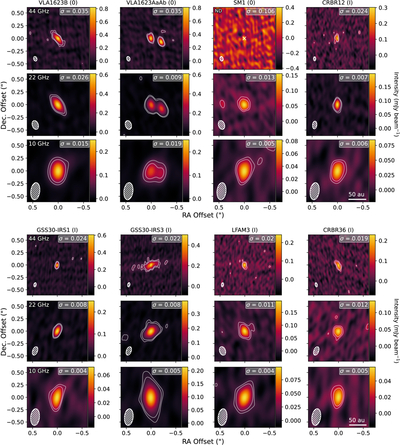
Caption: Figure C1.
VLA continuum images for the Q (44 GHz), K (22 GHz), and X (10 GHz) bands and respective 3σ and 5σ contours broken into two blocks. rms values in mJy beam−1 are shown in the top right of each panel. For the nondetection (ND) in SM1, we indicate the expected position with a white cross. Image beam sizes and PAs are shown as the hatched ellipse in the bottom left of each panel. We include a 50 au scale bar in the bottom-right panel of each block shared across all images. Each row corresponds to a single frequency and each column, per block, to a single object. Object names and classes are found in the column title.
Other Images in This Article
Show More
Copyright and Terms & Conditions
© 2026. The Author(s). Published by the American Astronomical Society.

