

Image Details
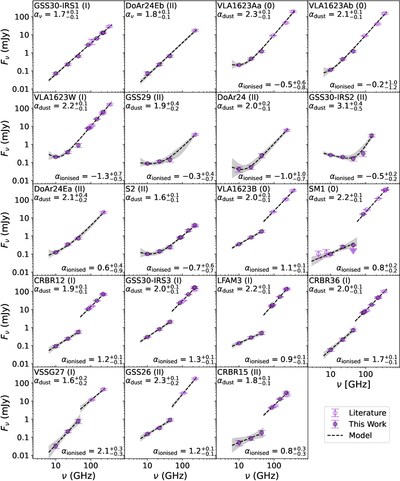
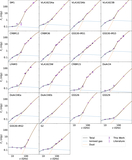
Caption: Figure 5.
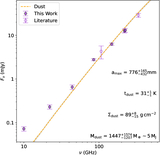
Radio SEDs and their derived spectral indices for all objects in our sample, annotated in the top left alongside their class. Flux densities taken from this work are presented with filled circles and flux densities from the literature are shown as open circles. Posterior realizations are shown as gray shaded regions, with the posterior median indicated as black dashed lines. For GSS30-IRS1 and DoAr24Eb, we use a single power-law fit to the radio SED and so only present α. Spectral indices for αdust are shown in the top left and αionized in the bottom right.
Other Images in This Article
Show More
Copyright and Terms & Conditions
© 2026. The Author(s). Published by the American Astronomical Society.

Copyright ©
2026 Astronomy Image Explorer. All Rights Reserved.
