

Image Details
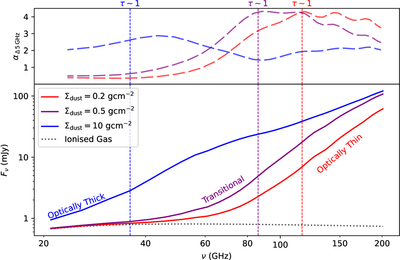
Caption: Figure 8.
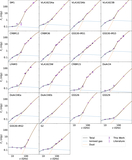
Theoretical radio SEDs (bottom) and their local spectral indices (top), which emulate different optical-depth scenarios by assuming a range of Σdust values. The spectral index, αΔ5GHz, is calculated at 5 GHz intervals along the radio SED and plotted against the midpoint of the frequency range. We annotate τ ∼ 1 in each model with a dashed line, showing the optically thick to optically thin transition. Each model has a constant Tdust = 21 K, ﹩{a}_{{\rm{\max }}}=﹩ 0.8 mm, and Ωdust = 1 × 10¹¹ Sr for the dust component and a constant EM = 9 × 108cm−6 pc and Ωionized = 13 × 10−1 Sr for the ionized gas (black dotted line).
Other Images in This Article
Show More
Copyright and Terms & Conditions
© 2026. The Author(s). Published by the American Astronomical Society.

