

Image Details
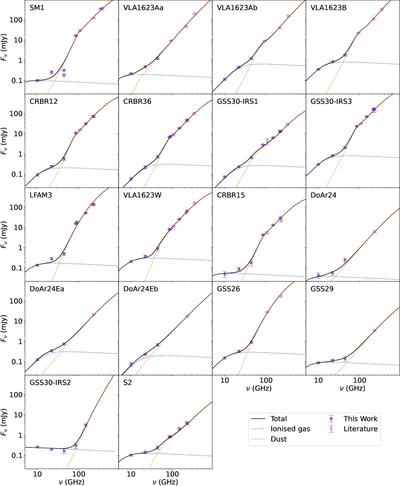
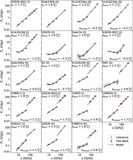
Caption: Figure 6.
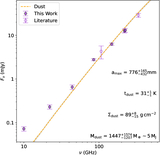
SED models for each object as presented in Table 3. Orange and blue dashed lines show the contributions of dust and ionized gas emission components, respectively. The total integrated flux density is shown as a black solid line. Flux densities from this work are shown as filled purple circles and those from the literature as open circles. Upper limits are denoted with downward arrows.
Other Images in This Article
Show More
Copyright and Terms & Conditions
© 2026. The Author(s). Published by the American Astronomical Society.

Copyright ©
2026 Astronomy Image Explorer. All Rights Reserved.
