

Image Details
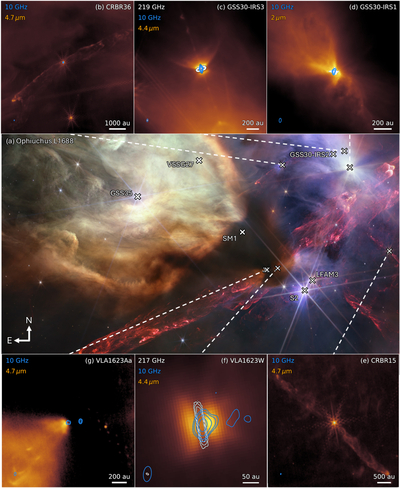
Caption: Figure 1.
(a) NIRCam first anniversary image of the Ophiuchus L1688 core (NASA/ESA/CSA/STScI) overlaid with white crosses representing the positions of a subset of objects in our sample. Image colors correspond to emission from the following filters: F187N (blue), F200W (light blue) F335W (cyan), F444W (yellow), and F470N (red). Inset panels (b)–(g) show zoomed-in 2, 4.4, and 4.7 μm images, corresponding to the F200W, F444W, and F470N filters, respectively. In each panel, we overlay 10 GHz continuum contours (blue) corresponding to 3σ, 5σ, 10σ, and 20σ, while panels (c) and (f) additionally show ALMA 217–219 GHz contours (white), corresponding to 5σ, 10σ, 20σ, and 100σ, with σ as defined in Table E1. Note the central white regions of panels (c) and (d) are saturated in NIRCam and contain no data.
Other Images in This Article
Show More
Copyright and Terms & Conditions
© 2026. The Author(s). Published by the American Astronomical Society.

