

Image Details
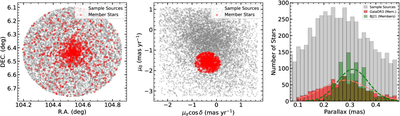
Caption: Figure 1.
Spatial, kinematic, and astrometric distributions of Berkeley 32. The left panel displays the spatial distribution of sources in equatorial coordinates (α, δ), the middle panel presents the VPD highlighting the separation between the cluster bulk motion and the field, and the right panel shows the distribution of trigonometric parallaxes. In all panels, gray points and histograms represent the full sample of sources within the investigated field of view, while red circles and red-filled bars denote the most probable cluster members identified using Gaia DR3 astrometry. Green-filled bars show the parallax distribution of the same members derived from C. A. L. Bailer-Jones et al. (2021) photogeometric distances, with dashed pink and green curves representing Gaussian fits to the respective distributions.
Other Images in This Article
Show More
Copyright and Terms & Conditions
© 2026. The Author(s). Published by the American Astronomical Society.

