

Image Details
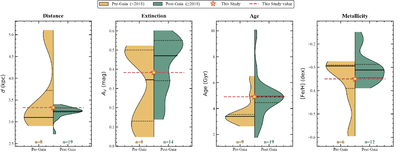
Caption: Figure 10.
Literature values for Berkeley 32 before and after the Gaia era. The panels show the distributions of distance, extinction (AV), age, and metallicity ([Fe/H]), with pre-Gaia studies (τ < 2018; orange) and post-Gaia studies (τ ≥ 2018; green). The dashed black lines mark the medians. The red star shows our result, and the horizontal red dashed line highlights its value. Sample sizes are given at the bottom of each panel.
Other Images in This Article
Show More
Copyright and Terms & Conditions
© 2026. The Author(s). Published by the American Astronomical Society.

Copyright ©
2026 Astronomy Image Explorer. All Rights Reserved.
