

Image Details
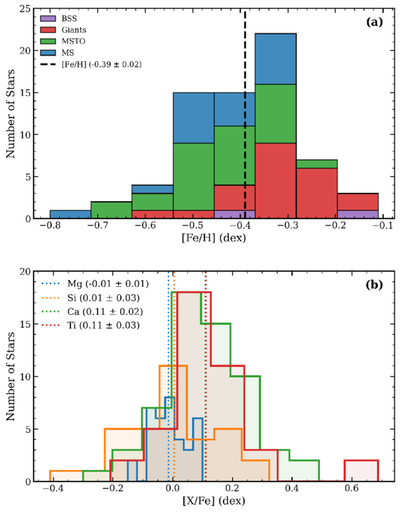
Caption: Figure 4.
Element-abundance distributions of Berkeley 32 member stars with SNR ≥ 30 derived from the GES data. Panel (a) presents the [Fe/H] distribution, where different colors within each histogram bin denote the number of stars belonging to different evolutionary stages. Panel (b) shows the abundance distributions of the α elements Mg, Si, Ca, and Ti. The vertical dashed lines represent the median values of the distributions, while the quoted uncertainties correspond to the standard error of the median.
Other Images in This Article
Show More
Copyright and Terms & Conditions
© 2026. The Author(s). Published by the American Astronomical Society.

Copyright ©
2026 Astronomy Image Explorer. All Rights Reserved.
