

Image Details
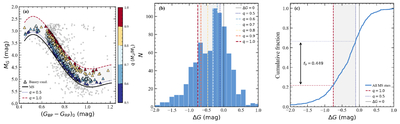
Caption: Figure 6.
Binary-fraction analysis of Berkeley 32. (a) CMD of the MS stars. The solid line shows the MS; the dashed and dotted lines mark the lower and upper limits of the binary selection region, respectively. Triangle symbols indicate binary candidates. (b) Distribution of ΔG residuals. The shaded region denotes the binary selection zone between the lower and upper limits. (c) Cumulative distribution of ΔG. The binary fraction fb is indicated by the vertical arrow spanning the two selection limits.
Other Images in This Article
Show More
Copyright and Terms & Conditions
© 2026. The Author(s). Published by the American Astronomical Society.

Copyright ©
2026 Astronomy Image Explorer. All Rights Reserved.
