

Image Details
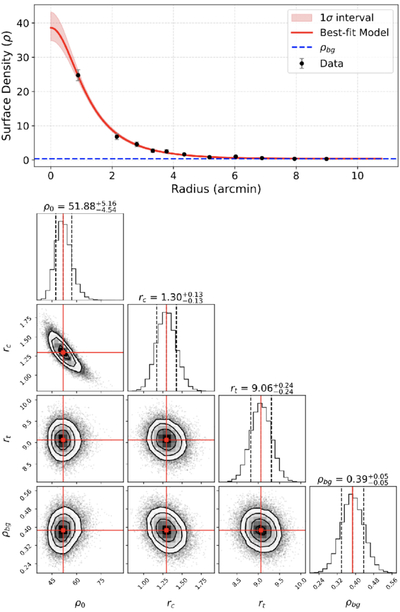
Caption: Figure 2.
RDP and MCMC posterior distributions for Berkeley 32. Upper panel: observed surface density (ρ) as a function of radial distance from the cluster center (black points with Poisson error bars). The solid red curve is the best-fitting I. King (1962) model, with the shaded region indicating the 1σ confidence interval. The horizontal blue dashed line marks the background density level (ρbg). Lower panels: corner plot of the posterior distributions for the fitted King model parameters (ρ0, rc, rt, ρbg), with median values (solid red lines) and 1σ boundaries (dashed lines).
Other Images in This Article
Show More
Copyright and Terms & Conditions
© 2026. The Author(s). Published by the American Astronomical Society.

Copyright ©
2026 Astronomy Image Explorer. All Rights Reserved.
