

Image Details
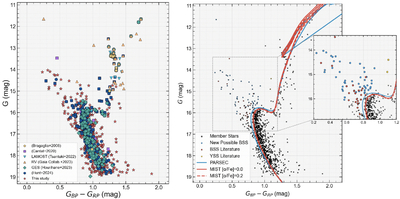
Caption: Figure 5.
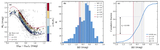
CMDs of the high-probability cluster members. Members are plotted and color coded according to crossmatched literature catalogs, as indicated in the legend. The red stars represent the members identified in this study (left panel). Member stars are displayed as black points (right panel). Red and yellow symbols indicate literature BSS and YSS stars, while blue symbols show the photometric BSS candidates identified in this study. The solid curves represent the best-fitting theoretical PARSEC (blue) and MIST (red) isochrones. Their corresponding upper and lower age uncertainties are indicated by the dashed lines, demonstrating the consistency between the observed stellar sequences and the derived fundamental parameters for both models.
Other Images in This Article
Show More
Copyright and Terms & Conditions
© 2026. The Author(s). Published by the American Astronomical Society.

