

Image Details
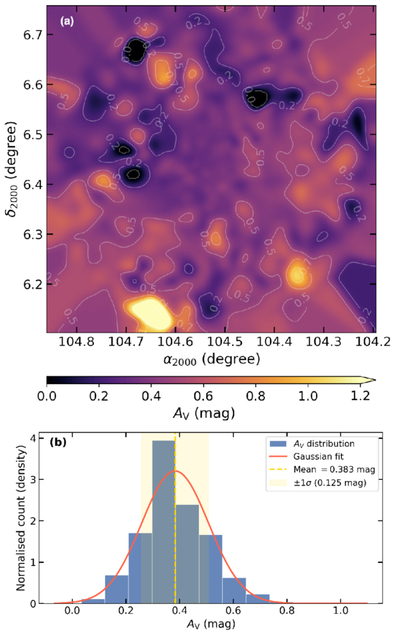
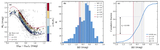
Caption: Figure 3.
Extinction map and distribution of the cluster member stars. (a) Spatial variation of AV (in magnitudes) derived from the BAYESTAR19 dust model (G. M. Green et al. 2019). Contours and color scale indicate the extinction level across the cluster field. (b) Distribution of individual AV values for member stars. The red curve shows the Gaussian fit to the distribution, while the dashed vertical line marks the mean value. The shaded region indicates the ±1σ interval.
Other Images in This Article
Show More
Copyright and Terms & Conditions
© 2026. The Author(s). Published by the American Astronomical Society.

Copyright ©
2026 Astronomy Image Explorer. All Rights Reserved.
