

Image Details
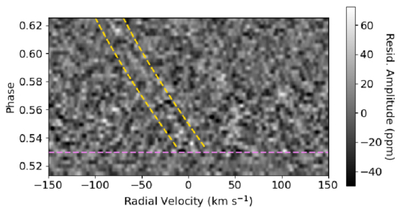
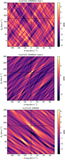
Caption: Figure 5.
2D cross-correlation grid for the CRIRES+ Visit 2 dataset in Earth’s rest frame. Each row is a resulting CCF between the model spectra of CoRoT-2 b that contained CO and H2O and a cleaned time-series spectrum. Larger residual amplitudes indicate positive correlation between the model and the data. The horizontal violet dashed line indicates the end of secondary eclipse, while the yellow dashed lines show the planet’s expected velocity. A faint region of increased residual amplitudes between the gold dashed lines shows that the planet is detected.
Other Images in This Article

Show More
Copyright and Terms & Conditions
© 2026. The Author(s). Published by the American Astronomical Society.

Copyright ©
2026 Astronomy Image Explorer. All Rights Reserved.
