

Image Details
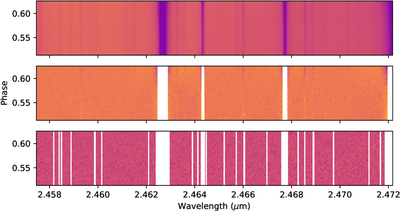
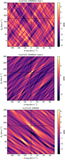
Caption: Figure 3.
Time-series spectra for a single CRIRES+ order, showing an example of the cleaning steps that were undertaken and the final spectrum. The top panel shows the pipeline-reduced spectrum after a normalization, sigma clipping, and application of a high-pass filter. The spectrum in the middle panel show the spectrum after the deepest tellurics were masked and the average spectrum in time was removed. The main features that can be seen at this point are residuals from the shallower tellurics. The bottom panel shows our final cleaned spectrum, after applying the SYSREM algorithm and masking out any columns that had large standard deviations.
Other Images in This Article

Show More
Copyright and Terms & Conditions
© 2026. The Author(s). Published by the American Astronomical Society.

