

Image Details
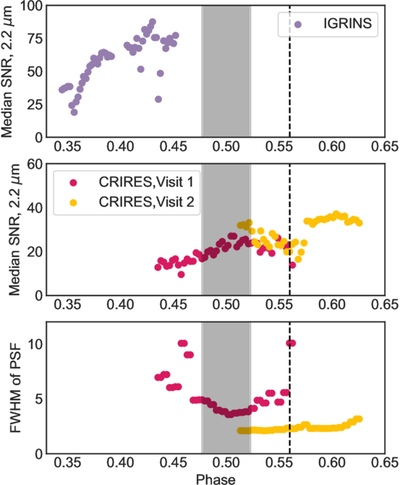
Caption: Figure 2.
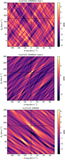
Top: the median SNR of each exposure as a function of phase in the IGRINS observation epochs. We report the median SNR over all pixels in single order (order eight in the K band), which covers the region containing the CO bandheads, around 2.2 μm. The semitransparent gray region shows the time when the planet was behind the star during secondary eclipse, while the black dashed line shows the time when the planet is expected to display its peak brightness from phase-curve observations. Middle: the same plot as above, but now showing the median SNR of the two CRIRES+ observation epochs. Again, we use a single order (order 15) with as similar wavelength coverage to the IGRINS order as possible. We see that Visit 2 had on average double the SNR per exposure as Visit 1. Bottom: the same plot as above, but now showing the FWHM of the PSF on the slit detector in pixels. We note that the FWHM is stable to ±5% across the orders, and so while this plot is specifically created by fitting order 15, the plot would not change significantly for different orders. The FWHM of the PSF is used to estimate the spectral resolution when the PSF is narrower than the slit width of ∼3.5 pixels. The FWHMs measured during Visit 2 are consistently ∼2 pixels throughout the night, which corresponds to a spectral resolution of 120,000.
Other Images in This Article

Show More
Copyright and Terms & Conditions
© 2026. The Author(s). Published by the American Astronomical Society.

