

Image Details
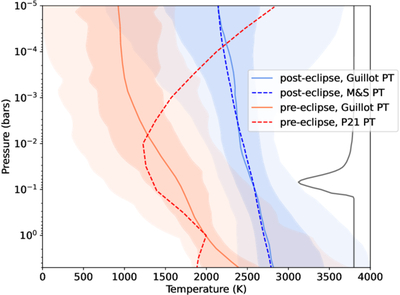
Caption: Figure 10.
Retrieved PT profiles using the posteclipse CRIRES+ data (blues) and the preeclipse IGRINS data (reds), published in Y. Shu et al. (2026). The profiles plotted with the solid lines are both parameterized using the same modified T. Guillot (2010) formulation, specified in P. Mollière et al. (2019). The shaded regions correspond to the 1σ and 2σ uncertainty regions for the T. Guillot (2010) profiles. The profiles with the dashed lines use a free parameterization with pressure anchor points. For the IGRINS data this profile was fit using the S. Pelletier et al. (2021) parameterization, and for the CRIRES+ data the N. Madhusudhan & S. Seager (2009) parameterization. The black solid line shows a contribution function for the CRIRES+ T. Guillot (2010) PT retrieval, to demonstrate where in altitude the observations are most sensitive. The different PT parameterizations show consistent results within the region where the signal originates, demonstrating that the differences in the pre- and posteclipse PT profiles is unlikely due to any choice in the PT parameterizations. We find that the posteclipse data is better fit with a hotter PT profile that is more isothermal, whereas the preeclipse data prefers a cooler temperature but with a larger gradient in temperature change (a less steep PT profile).
Other Images in This Article

Show More
Copyright and Terms & Conditions
© 2026. The Author(s). Published by the American Astronomical Society.

