

Image Details
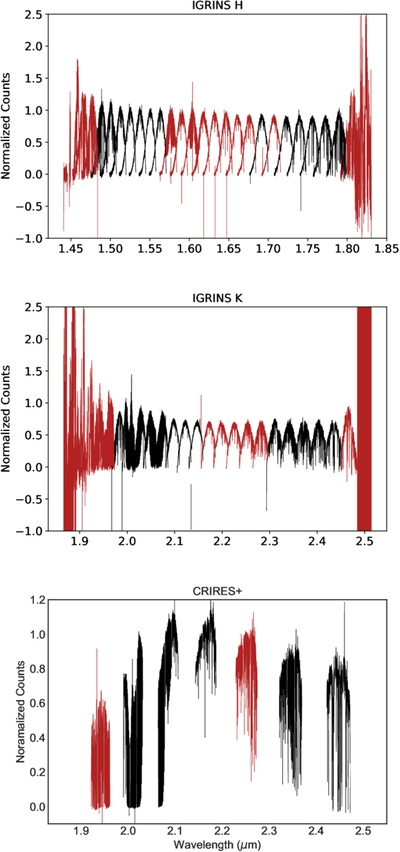
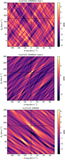
Caption: Figure 4.
Representative spectra of CoRoT-2 taken with IGRINS in the H band (top), K band (middle), and with CRIRES+ using the K2166 setting (bottom). These plots show all orders of a single time-series spectrum produced by the data reduction pipeline steps before any spectral cleaning has been done. The orders plotted in black are the orders which are used in the final combined 2D cross-correlation grids, while the orders in red are thrown out as they did not produce a large signal in our injection and recovery tests. The lack of signal is due to either low SNR of the orders (i.e., orders at the edge of the detector), telluric contamination, or orders where there is not significant opacity from CO or H2O (i.e., around 1.65 or 2.2 μm). We also found significant CH4 contamination in the Visit 2 CRIRES+ spectra in the region around 2.25 μm, and so we opted to discard these data as well.
Other Images in This Article

Show More
Copyright and Terms & Conditions
© 2026. The Author(s). Published by the American Astronomical Society.

