

Image Details
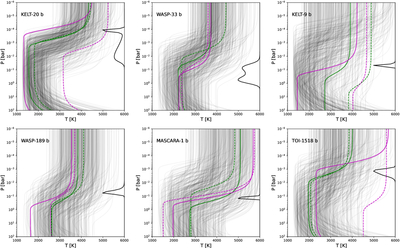
Caption: Figure 5.
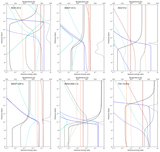
Retrieved P−T profiles for each target. The median profiles are shown in green and maximum likelihoods are shown in purple, with the free retrievals shown as solid lines and the equilibrium retrievals as dashed lines. The black lines show 500 draws from the posterior. The black line to the right shows the wavelength-median emission contribution function for the maximum-likelihood profile from the free retrieval. Strong thermal inversions are preferred in all targets. However, the absolute temperatures of the P−T profiles are poorly constrained, and the pressure level of the inversion shows a large scatter across targets. HRCCS is more sensitive to the thermal contrast of the P−T profile, which sets the strength of spectral features, rather than the absolute temperature, which sets the continuum level. Over short bandpasses, the data detrending procedure effectively removes the planetary continuum, and retrievals therefore provide only limited constraints on the absolute temperature and inversion pressure. The emission contribution functions generally peak where the temperature is rapidly changing with altitude, but can also be impacted by dissociation, which can be seen in KELT-20 b. See L. Finnerty et al. (2025a) for further discussion.
Other Images in This Article
Show More
Copyright and Terms & Conditions
© 2026. The Author(s). Published by the American Astronomical Society.

