

Image Details
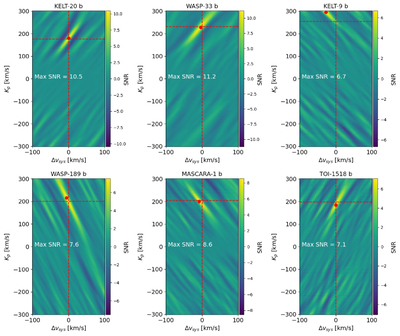
Caption: Figure 3.
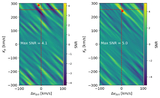
Kp−Δvsys diagrams for the free retrieval maximum-likelihood model for each target, omitting six principal components. The maps are computed with the log-likelihood function, and converted to SNR by first median subtracting each row of constant Kp and then dividing by the standard deviation of the Kp < 0 region. The nominal planetary Kp and Δvsys are indicated in dashed red, and the red dot indicates the location of maximum SNR in the Kp−Δvsys map. All targets are detected at SNR > 6. KELT-20 b and WASP-33 b are very strongly detected at SNR > 10, while WASP-189 b, MASCARA-1 b, and TOI-1518 b are detected at SNR > 7. KELT-9 b is the most weakly detected at SNR = 6.7, despite a total observation SNR substantially greater than was obtained for WASP-33 b. This discrepancy could be explained by dissociation of nearly all molecules in KELT-9 b, which is the hottest target by a margin of more than 1000 K. For all targets, the maximum in the Kp−Δvsys diagram is consistent with the expected Kp and Δvsys, and dominates over other features in the map, providing confidence that the features being fit in the retrieval are associated with the planet and not with uncorrected residuals.
Other Images in This Article
Show More
Copyright and Terms & Conditions
© 2026. The Author(s). Published by the American Astronomical Society.

