

Image Details
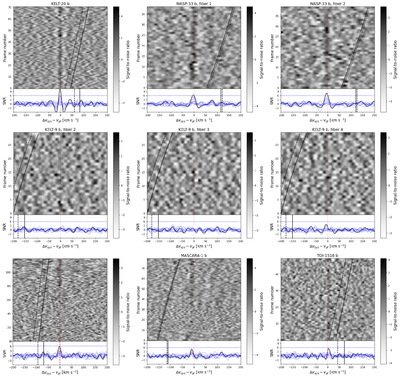
Caption: Figure 2.
Time-series log likelihoods in the nominal planet rest frame computed for each frame (top) and summed in the planet reference frame (bottom) for each target and time series. The nominal planet reference frame is indicated in dotted red, the stellar reference frame in solid black, and the telluric reference frame in dashed black. In the lower panel, individual orders are shown in blue, while the sum of all orders is shown in black. For the top panel, the log likelihoods for each frame are median subtracted and divided by the standard deviation of the Δvsys − vpl > 50 km s−1 region to reduce frame-to-frame variations for clarity and convert to a noise map. The the bottom panel, we convert to SNR by dividing by the standard deviation of the Δvsys − vpl > 50 km s−1 region after summing over the entire time series. As a result of the different noise region definitions, the SNRs differ from the Kp−Δvsys plots in Figure 3. KELT-20 b and WASP-33 b are obvious even in the 2D plots, while WASP-189 b, MASCARA-1 b, and TOI-1518 b show SNR ∼ 5 detections after summing over the time series. The three individual time series for KELT-9 b do not show a significant detection, but coadding all three time series results in a weak detection in the Kp−Δvsys maps.
Other Images in This Article
Show More
Copyright and Terms & Conditions
© 2026. The Author(s). Published by the American Astronomical Society.

