Image Details
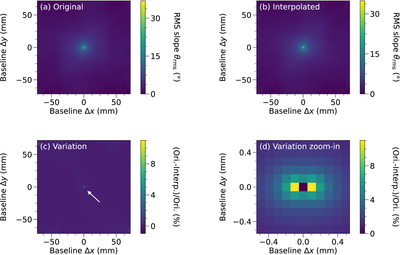
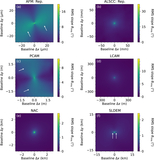
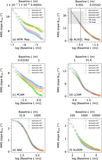
Caption: Figure A12.
rms slopes of the original (panel (a)) and interpolated (panel (b)) ALSCC ROIs. Variation (panel (c)) in rms slopes is shown between the original and interpolated ALSCC ROIs. Panel (d) is a zoomed-in region at the center of panel (c). In panel (c), the white arrow indicates that the difference between the original and interpolated ALSCC ROIs is more pronounced at shorter baselines.
Other Images in This Article
Show More
Copyright and Terms & Conditions
© 2026. The Author(s). Published by the American Astronomical Society.
Copyright ©
2026 Astronomy Image Explorer. All Rights Reserved.