Image Details
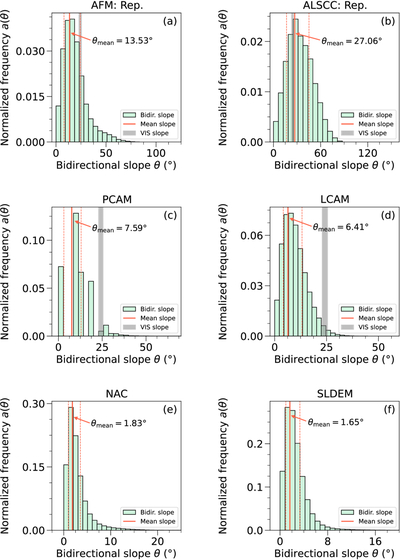
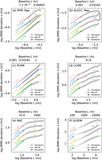
Caption: Figure 6.
Normalized frequency distributions of bidirectional slopes (light green) of the AFM (panel (a)), ALSCC (panel (b)), PCAM (panel (c)), LCAM (panel (d)), NAC (panel (e)), and SLDEM (panel (f)) ROIs. Hapke’s mean slope and its uncertainty are denoted by the red solid and dashed lines. In panels (a)–(d), the effective slope (22.9°–25.5°) inverted by the LROC/WAC images in the visible bands is indicated by the vertical gray shaded area.
Other Images in This Article
Show More
Copyright and Terms & Conditions
© 2026. The Author(s). Published by the American Astronomical Society.
Copyright ©
2026 Astronomy Image Explorer. All Rights Reserved.