Image Details
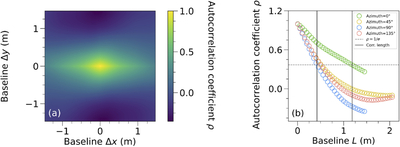
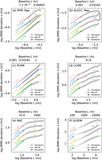
Caption: Figure 9.
Two-dimensional autocorrelation coefficient (panel (a)) and its representative 1D profiles (panel (b)) of the PCAM ROI. The 1D profiles have azimuth angles of 0° (green), 45° (yellow), 90° (blue), and 135° (red) with respect to the horizontal axis in their 2D autocorrelation coefficient. In panel (b), the autocorrelation coefficient of 1/e is marked by the horizontal dashed line, and the range of the autocorrelation lengths is denoted by the vertical solid lines.
Other Images in This Article
Show More
Copyright and Terms & Conditions
© 2026. The Author(s). Published by the American Astronomical Society.
Copyright ©
2026 Astronomy Image Explorer. All Rights Reserved.