Image Details
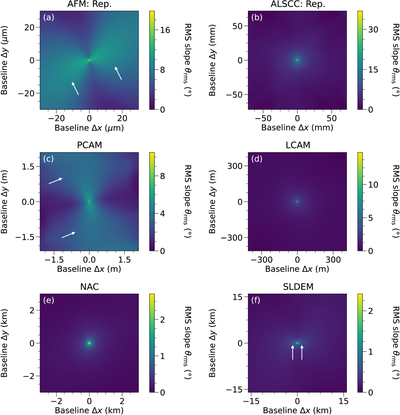
Caption: Figure 7.
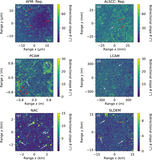
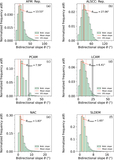
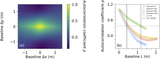
Two-dimensional rms slopes of the AFM (panel (a)), ALSCC (panel (b)), PCAM (panel (c)), LCAM (panel (d)), NAC (panel (e)), and SLDEM (panel (f)) ROIs. In panels (a), (c), and (f), the arrows point to the butterfly pattern that results from the background gradient in the 2D rms deviation (double-headed arrows in Figure 3).
Other Images in This Article
Show More
Copyright and Terms & Conditions
© 2026. The Author(s). Published by the American Astronomical Society.
Copyright ©
2026 Astronomy Image Explorer. All Rights Reserved.