Image Details
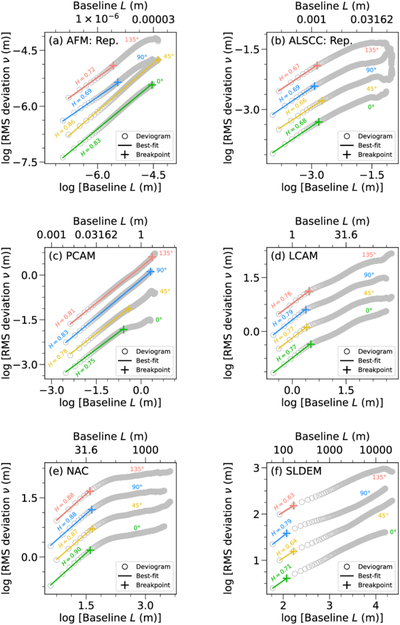
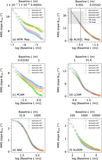
Caption: Figure 4.
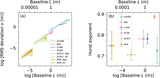
Representative 1D deviograms (circles) and their linear best fits (lines) and breakpoints (crosses) of the AFM (panel (a)), ALSCC (panel (b)), PCAM (panel (c)), LCAM (panel (d)), NAC (panel (e)), and SLDEM (panel (f)) ROIs. The 1D deviograms and their linear best fits and breakpoints are shown for radial profiles with azimuth angles of 0° (green), 45° (yellow), 90° (blue), and 135° (red) with respect to the horizontal axis in their 2D deviograms. The Hurst exponent (H) is indicated by the slope of the linear best fit. The 1D deviograms are shifted vertically for clarity.
Other Images in This Article
Show More
Copyright and Terms & Conditions
© 2026. The Author(s). Published by the American Astronomical Society.
Copyright ©
2026 Astronomy Image Explorer. All Rights Reserved.