Image Details
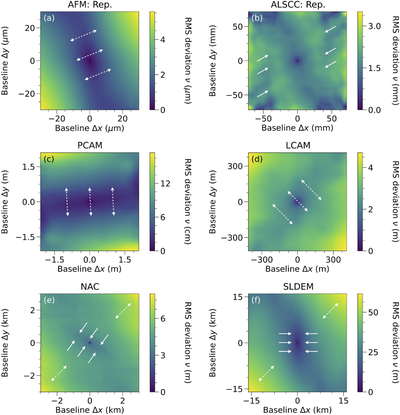
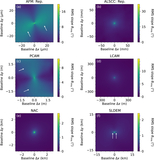
Caption: Figure 3.
Two-dimensional rms deviations of the AFM (panel (a)), ALSCC (panel (b)), PCAM (panel (c)), LCAM (panel (d)), NAC (panel (e)), and SLDEM (panel (f)) ROIs shown in Figure 1. In panels (a) and (c)–(f), the double-headed arrows indicate the direction of the gradient. In panel (b), the arrows denote the localized regions with larger rms deviations. In panels (e) and (f), the arrows point to the elongated regions with smaller rms deviations.
Other Images in This Article
Show More
Copyright and Terms & Conditions
© 2026. The Author(s). Published by the American Astronomical Society.
Copyright ©
2026 Astronomy Image Explorer. All Rights Reserved.