Image Details
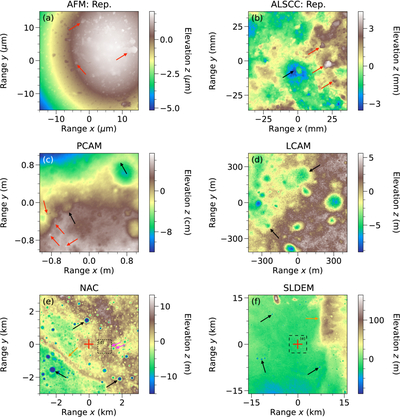
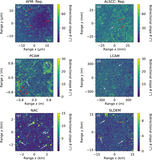
Caption: Figure 1.
Surface elevations of the AFM (panel (a)), ALSCC (panel (b)), PCAM (panel (c)), LCAM (panel (d)), NAC (panel (e)), and SLDEM (panel (f)) ROIs. In panels (a)–(f), all black arrows point to the rims of degraded or fresh craters, as well as the center of a depression. In panels (a)–(c), all red arrows point to rocks or particles. In panels (e) and (f), the red crosses denote the CE-6 landing site, the orange arrows point to the wrinkle ridges, and the dashed boxes indicate the extents of the LCAM and NAC ROIs. In panel (e), the magenta arrows denote the craters leading to the tilted background of the LCAM ROI.
Other Images in This Article
Show More
Copyright and Terms & Conditions
© 2026. The Author(s). Published by the American Astronomical Society.