Image Details
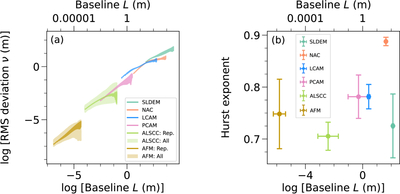
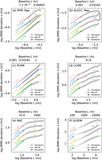
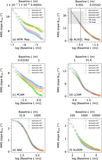
Caption: Figure 10.
rms deviations (panel (a)) and Hurst exponents (panel (b)) as a function of baseline derived from the AFM (brown), ALSCC (light green), PCAM (pink), LCAM (blue), NAC (orange), and SLDEM (dark green) ROIs. In panel (a), rms deviations of representative and all AFM and ALSCC ROIs are shown in darker and lighter colors, respectively. In panel (b), the dots and error bars represent the average value and 1σ deviation of the Hurst exponents derived from the 13 deviogram profiles.
Other Images in This Article
Show More
Copyright and Terms & Conditions
© 2026. The Author(s). Published by the American Astronomical Society.
Copyright ©
2026 Astronomy Image Explorer. All Rights Reserved.