Image Details
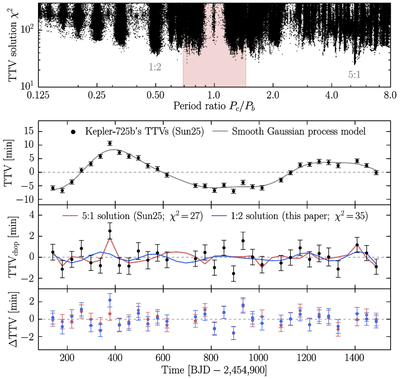
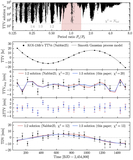
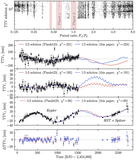
Caption: Figure 7.
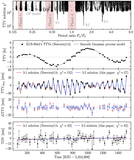
Kepler-725. Top panel: χ2 vs. period ratio (Ndof = 18). The 5:1 solution provides the best fit by a slim margin, followed by the 1:2 solution and many others. Second panel: TTVs, as measured by T. Holczer et al. (2016) and used in L. Sun et al. (2025). The gray curve is a GP model, used as a smooth interpolant to separate long- and short-timescale variations. Third panel: high-pass-filtered TTVs obtained by subtracting the GP. The red curve shows the best variant of the 5:1 solution (L. Sun et al. 2025), and the blue curve shows the 1:2 solution. Fourth panel: residuals of the 5:1 solution (rms = 0.71 minutes) and the 1:2 solution (rms = 0.81 minutes). The differences between the models are minor; Kepler-725’s TTV solution is not unique, and does not necessarily involve a planet in the habitable zone.
Other Images in This Article
Show More
Copyright and Terms & Conditions
© 2026. The Author(s). Published by the American Astronomical Society.