Image Details
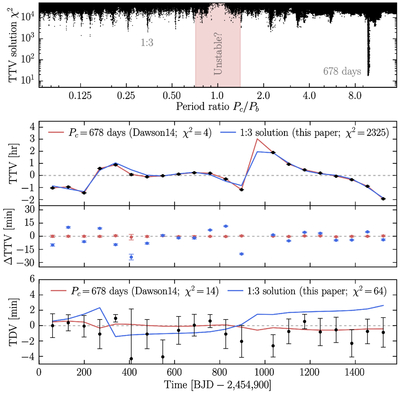
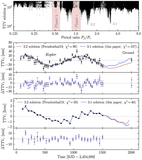
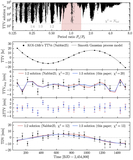
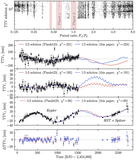
Caption: Figure 2.
Kepler-419. Top panel: χ2 vs. period ratio (Ndof = 29). The 678 day solution is far superior to all other solutions. Second panel: TTVs measured by R. I. Dawson et al. (2014). The red curve shows the best variant of the Pc = 678 day solution (R. I. Dawson et al. 2014). The red curve shows the 1:3 solution (Pc = 24 days), which is second-best. Third panel: residuals of the 678 day solution (rms = 0.4 minute) and the 1:3 solution (rms = 8.9 minute). Fourth panel: TDVs and predictions of the 678 and 24 day models. Both models predict little variation, but the 678 day model provides a better fit. It seems safe to conclude that Kepler-419’s TTV solution is unique.
Other Images in This Article
Show More
Copyright and Terms & Conditions
© 2026. The Author(s). Published by the American Astronomical Society.