Image Details
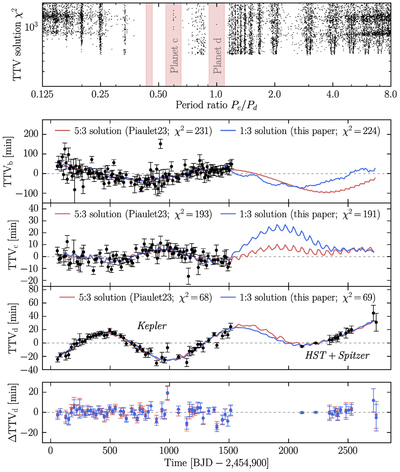
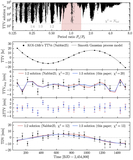
Caption: Figure 10.
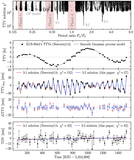
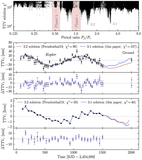
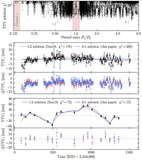
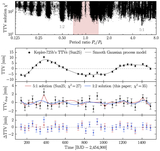
Kepler-138. Top panel: χ2 vs. period ratio (Ndof = 243). Many solutions provide an equally good fit to the TTV data. Second panel: Planet b’s TTVs, as measured by D. Jontof-Hutter et al. (2015). The red curve shows the best variant of the 5:3 solution (C. Piaulet et al. 2023), and the blue curve shows the 1:3 solution. Third panel: Planet c’s TTVs, along with the predictions of the 5:3 and 1:3 models. Fourth panel: Planet d’s TTVs, including Kepler transits from D. Jontof-Hutter et al. (2015) and HST/Spitzer transits from C. Piaulet et al. (2023). Fifth panel: Planet d’s TTV residuals for the 5:3 solution (rms = 5.0 minutes) and 1:3 solution (rms = 5.0 minutes). These two models, and many others, fit Kepler-138’s TTV data indistinguishably well (Δχ2 = 7).
Other Images in This Article
Show More
Copyright and Terms & Conditions
© 2026. The Author(s). Published by the American Astronomical Society.